A brand new business dashboard
New· Matt Franklin
Matt FranklinWe've rebuilt the dashboard from the ground up to give you a clear, real-time picture of how your business is performing.
At a glance, you can now see:
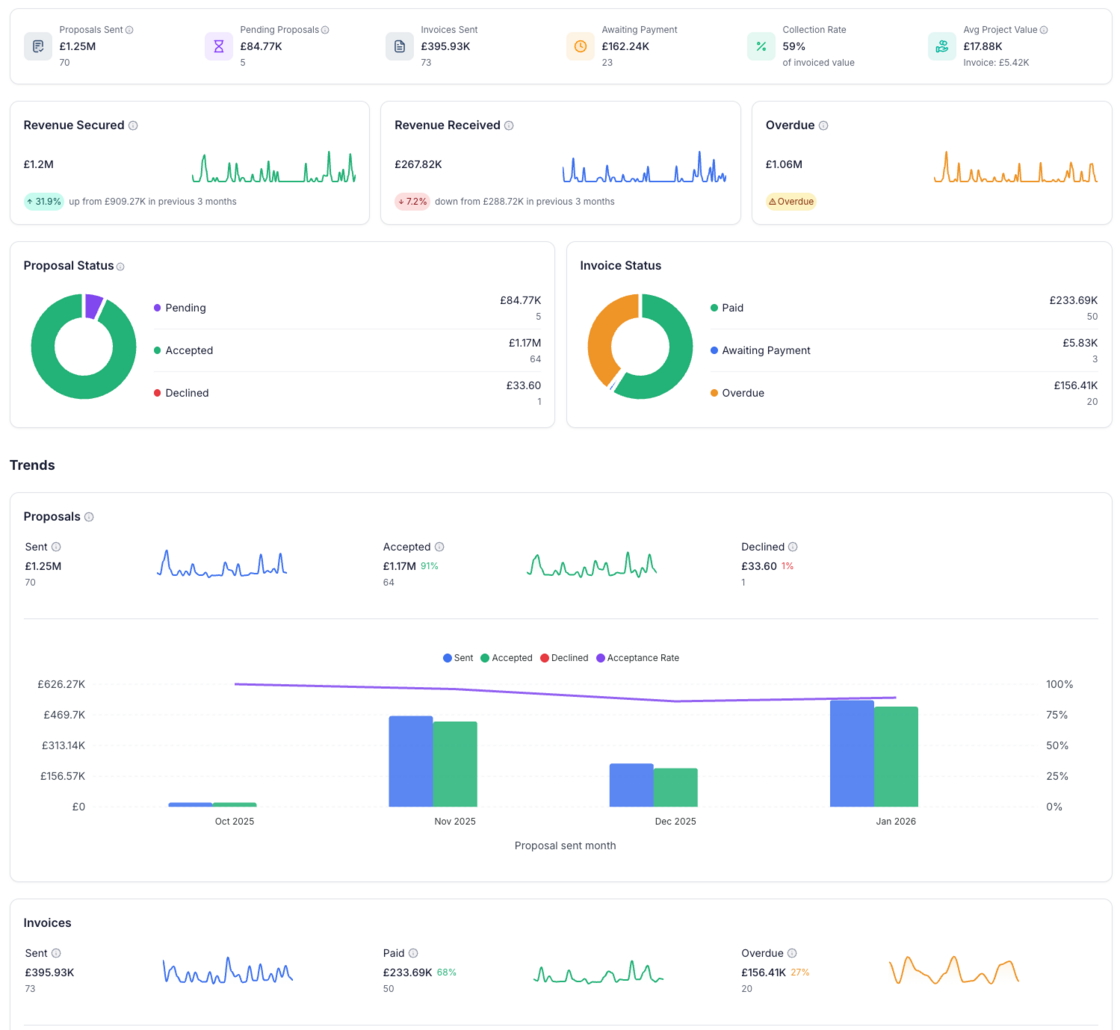
- Proposals sent, pending, and your average project value — so you always know what's in your pipeline
- Invoices sent, awaiting payment, and your collection rate — track cash flow at a glance
- Revenue secured vs revenue received — with sparkline charts showing daily trends and period-over-period comparisons
- Proposal and invoice status breakdowns — donut charts showing where your money sits (pending, accepted, declined / paid, awaiting, overdue)
- Monthly trends — see how your sent, accepted, and declined proposals (and invoices) are tracking over time, with acceptance and payment rates overlaid
Filter by time period — view this month, last month, last 3/6/12 months, or all time. Each view includes a comparison to the previous period so you can see whether you're trending up or down.
The new dashboard is available now alongside the classic view — switch between them using the toggle at the top of the page.
More to come on this one! We know it's missing a couple of key features from the classic dashboard so we've kept both for now.